Using Matlab for Detecting Edges in Images
Created and recorded by Yiming Cai. September 2021
Music by Armin Heller, see https://lmms.io/lsp/?action=show&file..., / twilight-area and https://creativecommons.org/licenses/...
Outline
Import picture into MatLab
Using matrix as a filter to detect the edge of graphic (basic)
How to keep more details in graphic edge detection
Lose details in edge detection
Script
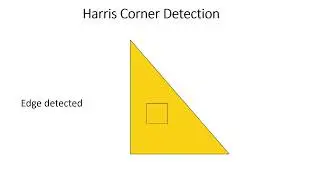
Image edge detection greatly reduces the amount of data and removes information that can be considered irrelevant, retaining important structural properties of the image. Image edge detection also has many applications in real life. For example, in medical field, we can use edge detection to check the lesions of skin cancer. In daily life we can also use edge detection for image segmentation. This video will teach you how to use MatLab to convert an image into a matrix and identify the edges in the image.
To use MatLab as a tool for edge detection, the first step we will need is to import the image into MatLab. It's very easy to import an image to MatLab, all you need is two lines
image = imread(‘filename.png’)
image = im2double(image)
Because it will be easier to detect edge from a black and white image, we will be using a gray scaled image
image = rbg2gray(image)
And now, we can see if our image is properly converted by using imshow
imshow(image)
Of course, in MatLab, there are some very easy methods of edge detection. You can just use
edge_canny = edge(image, ‘Canny’)
Or
edge _sobel = edge(image, ‘Sobel’)
Both will generate the edge of the function by different methods. Those quoted words at the end of lines are filters MatLab used to detect the edge.
These filters are built based on a matrix. Take Sobel as an example, if you want to use Sobel kernel without calling the edge function, you will need to defile the Sobel kernel first.
sob = [ -1, 0, 1; -2, 0, 2; -1, 0, 1]
So now, we can see our x gradient by using
gradx = imfilter(image, sob)
Because there shouldn’t be any negative values, we will need to use absolute function before showing the image
imshow(abs(gradx))
And this is our edges in the x-direction
To find edges in the y-direction, all you need is to use the sob inverse
grady = imfilter(image, sob’)
imshow(abs(grady))
Also you will want to combine both directions. In this case, all you will need is
gradimg = imfilter (gradx.^2 + grady.* grady)
imshow(gradimg)
After edge detection, it’s possible that you feel the edge contains too many details or not enough. If you use the edge function to find out edges, adjust the sensitivity will be a good method to add or lose details.
step_size = 0.0
sensitivity = edge _threshold + step_size
edge_prewitt = (image, ‘Prewitt’, sensitivity)
imshow(edge_prewitt)
If you are using matrix kernel, you can get rid of noise by using gaussian
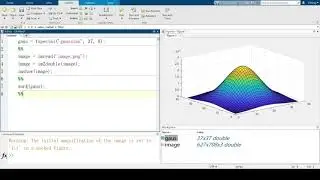
gausk = fspecial(‘gaussian’, 5, 1)
smoothimg = imfilter (image, gausk)
By now the original image has been smoothed by Gaussian kernel, we are going to detect its edges
smoothimg_edge = sqrt(imfilter(smoothimg, sob).^2 + imfilter(smoothimg, sob’).^2)
imshow(smoothimg_edge)


