Graph Display for Multi-dimensional Data in MATLAB
Created and recorded by Yiming Cai, November 2021
Music: "Call of the Void" by Justin Miles, https://lmms.io/lsp/?action=show&file... License: Creative Commons (by)
Outline
Recall from last video
Show examples of sliced data
How to slice multi-dimension matrix input
Plot 4d data via time
Summary
In previous video, I introduced how to plot 2d and 3d line datas in Matlab. When you have data such as 3d matrix, 4d matrix, you may want to plot partial or all data from the matrix you have. Today I will introduce the method of 3d and 4d matrix plotting, and how to get a slice of data.
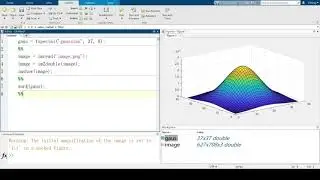
So in a 2d space, we can present 2d lines and images. In 3d space, we plotted 3d lines before. Same as 2d plots, plot3 can also plot 3d matrix.
3d matrix plot example
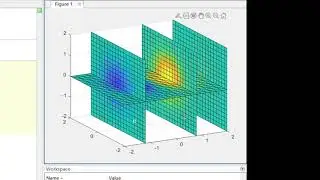
Also by using the built-in slice function, we can see the specific 2d plane of the matrix by providing the level we want.
Slice example
And in a 3d space, plot3 can present multiple splices in one plot
Multiple slice example
How about 4d data?
So let's see the example of 4d matrix plotting.
4d plots gif example
This is plotted by a set of 4d matrix data. So to understand what is 4d data, you could treat it as a record of a 3d object change via time. Human eyes cannot see 4d objects at the same time and 3d space. But, we can make a dynamic plot in 3d space to show the change of this 3d object.
So by looking at the workspace, you will notice that this data is a 4d matrix. We choose one dimension as the time argument, then use the for loop to each level of 3d matrix by plot3.
The time of matrix change can be adjusted with the time step argument.
Similarly, a 2d plot can also use this trick for 3d matrix, then the plot can build a 2d gif for 3d matrix.
In this video, we introduced the slice function for 3d matrix, plots for 4d data, and tricks to make gif via matrix in Matlab. Hope this video is helpful.


